

pipeline process) quick facts:
- exports ledger events into queryable data store
- does not send ledger commands
- is stateless
- is restart friendly (fast restarts in absence of migration, Daml model changes, etc)
- is tolerant to unavailable dependencies (through retry loop)
- uses only 1 Ledger API stream connection (flat transaction or transaction tree) after initialisation
- uses a pool of connections to Postgres (16 by default)
- can be secured with TLS on both connections
- uses OpenTelemetry Agent for its observability signals exports
- can export diagnostics archive (with metrics and thread dumps over time)
-
137indicates the process was killed by external forces withSIGKILL(-9), see also -
non-zero exit might indicate invalid starting conditions which are treated as non-recoverable errors. Causes might
include:
- misspelled startup parameter names or values
- ledger keep-alives are present
- watermark advances in the presence of expected ledger traffic, see also here and here
- retry loop indicates recoverable errors (both upstream and downstream), examine message for indication of underlying cause
- in case of non-recoverable errors, keep in mind that the last visible stacktrace does not necessarily represent the true root cause - explore events that preceded it by requesting a bigger slice of logs before the termination
-
correlate transactions
(
pipeline_events_total{type="transaction"}) and watermark (watermark_ix) throughput metrics to identify if any slowdowns are present in the PQS pipeline - get an idea of PQS pipeline introduced latency - see here
- get an idea of contract churn (which correlates with write activity of PQS) by template - see here
- get an idea of I/O split - disk vs index, cache sizing (tables and indexes)
- probe for heavy queries (current and over time)
-
inspect if
bgwriterflush triggers too frequently
Runbooks
Runbooks are recipes that provide instructions for handling common issues or tasks. They are designed to be easy to follow and should include all necessary steps to resolve an issue.PQS does not accept the passed in settings
Check if the argument in question is in the supported list of arguments by re-running the base command with:-
--help/-hoption for command-line arguments -
--help-verbose/-Hoption for command-line arguments, environment variables and Java system properties
Adjusting PQS settings dynamically (at runtime)
PQS does not allow one to adjust any of its settings on the fly. Configuration settings along with the dynamically resolved party filters and interface filters are fixed at the start of pipeline execution. Any change requires a restart, which should be fairly cheap under normal circumstances. You might also want to re-visit the configuration warning.Daml packages are an exception: when PQS detects a new package when processing a Daml payload received from the Ledger API, it reloads itself and fetches the missing packages (DARs) from the Participant Node. See Dynamic Daml package reload.
There is a suspicion that PQS is stalled
Check for ledger keep-alive output in the logs (frequency configured via--source-ledger-keepalive (default 40s)).
You should at least see this line repeated every 40 seconds, even if there is no new activity on the ledger:
Why might it take a long time before PQS starts processing streams?
The following phases happen during PQS startup:- fetching of all DARs from the ledger
- parsing DARs locally to extract type information (cached locally for subsequent restarts)
- converting type information into codecs
- initializing DB tables and partitions corresponding to templates/interfaces and exercises
- processing ACS if applicable
- pipeline with ongoing processing starts now
- slow network
- excessive number of DARs/packages on ledger (not yet cached by PQS)
- excessive number of new templates (likely caused by Daml upgrade/migration procedures)
- the size of ACS (if applicable)
- processing from early offsets (historical data) on a very lengthy ledger (will influence until PQS catches up to the head for ongoing streaming)
Don’t see expected templates in PQS
Check that your filter’s configuration is not too restrictive. Sanity check the overall count inINFO-level logs
DEBUG level (--logger-level=Debug) will provide more detailed
information about specific templates included in the synchronization pipeline:
Is it safe to change PQS --pipeline-datasource against the data store with existing data?
You might want to re-visit the configuration
warning.
Debug output is too noisy
To prevent excessive output from Netty when the logging level is set toDEBUG, use the following arguments:
No data for a recently onboarded party
PQS is not notified of new parties, so it needs a restart to acknowledge the new party set. Note that the best approach when onboarding new parties is to:- stop PQS from processing the data
- onboard the new party
- start PQS processing where it left off
-
purge the PQS database and re-ingest the data either from
Genesisor fromLatest(see Ledger streaming & recovery), or - perform a reset from a particular offset (before the offset of the first event with the new party involved) by following the instructions
PQS complains it cannot start due to various offset mismatches
PQS may fail to start due to a non-reconcilable gap in the events history (potentially caused by ledger pruning or other factors). Please, refer to these 2 sections for additional insights: In most likelihood, under normal conditions, PQS should be launched with the following arguments, unless there is a strong reason to modify them:Is it safe to restart PQS? Can data get corrupted?
PQS was designed with failure friendliness - it does not require graceful shutdown or draining of active tasks. It is absolutely fine if the JVM process gets killed. On a restart, PQS will perform a clean-up procedure of data beyond the current watermark and then re-subscribe and continue processing from the watermark’s offset onwards (see Recover).What happens if multiple PQS instances are launched against the same data store?
In case multiple PQS instances are launched against the same data store, no data corruption happens. However, they will be competing among themselves to become the exclusive writer, so it might affect the throughput of ledger stream consumption. It is unadvisable to do so (see also High availability).Which metrics are available? How to integrate them?
PQS Docker images are published with the preconfigured Prometheus endpoint (see Observe). By default, it listens on0.0.0.0:9090, so it is expected to be hooked into existing monitoring infrastructure.
To that extent, PQS releases are accompanied by dashboards that can be imported into a
Grafana instance for convenient visualisation of application health.
It is highly advised to implement an observability platform in your environment. While logs help troubleshoot
correctness issues, metrics are much more suitable for performance related troubleshooting.
PQS processing throughput seems low
PQS had been benchmarked against high throughput scenarios of up to 100K+ events/sec. PQS processing pipeline is just an intermediary between two data systems - ledger (Canton) and relational database (Postgres), so most likely to troubleshoot such a cause, one would need to dig into one of these endpoints. Suggested areas of attention (see also Optimize):-
ledger
- host/OS-level metrics - CPU, I/O, RAM, etc (look for resource saturation)
- check with Canton for relevant metrics
-
Postgres
- check minimum resources requirements for Postgres
- check host/OS-level metrics - CPU, I/O, RAM, etc (look for resource saturation)
- configuration settings and non-default overrides
-
metrics according to database (
pg_stat_statements,pg_stat_activity)
-
PQS
- check minimum resources requirements for PQS to avoid unexpected imbalance
- check host/OS-level metrics - CPU, I/O, RAM, etc (look for resource saturation)
-
ensure these settings are not set too low (no less than defaults)
-
--source-ledger-buffersize -
--target-postgres-buffersize -
--target-postgres-maxconnections(because parallel processing which affects both throughput and latency is tied to this configuration) - check vital metrics look good (PQS metrics dashboard and how to read it)
-
Dissecting the logs
PQS emits a healthy volume of relevant information while running intostdout stream. INFO level describes
application-level events such as:
- ledger keep-alives
- lifecycle information
- authentication events
- starting conditions - offsets, current watermark, etc
- ingress of ledger events
- conversion of payloads
- watermark advancement
DEBUG and TRACE levels add supplementary troubleshooting information. Caution needs to be exercised since
increasing the log level might affect performance negatively along with exposing sensitive data (contract’s contents,
for instance).
PQS metrics dashboard and how to read it
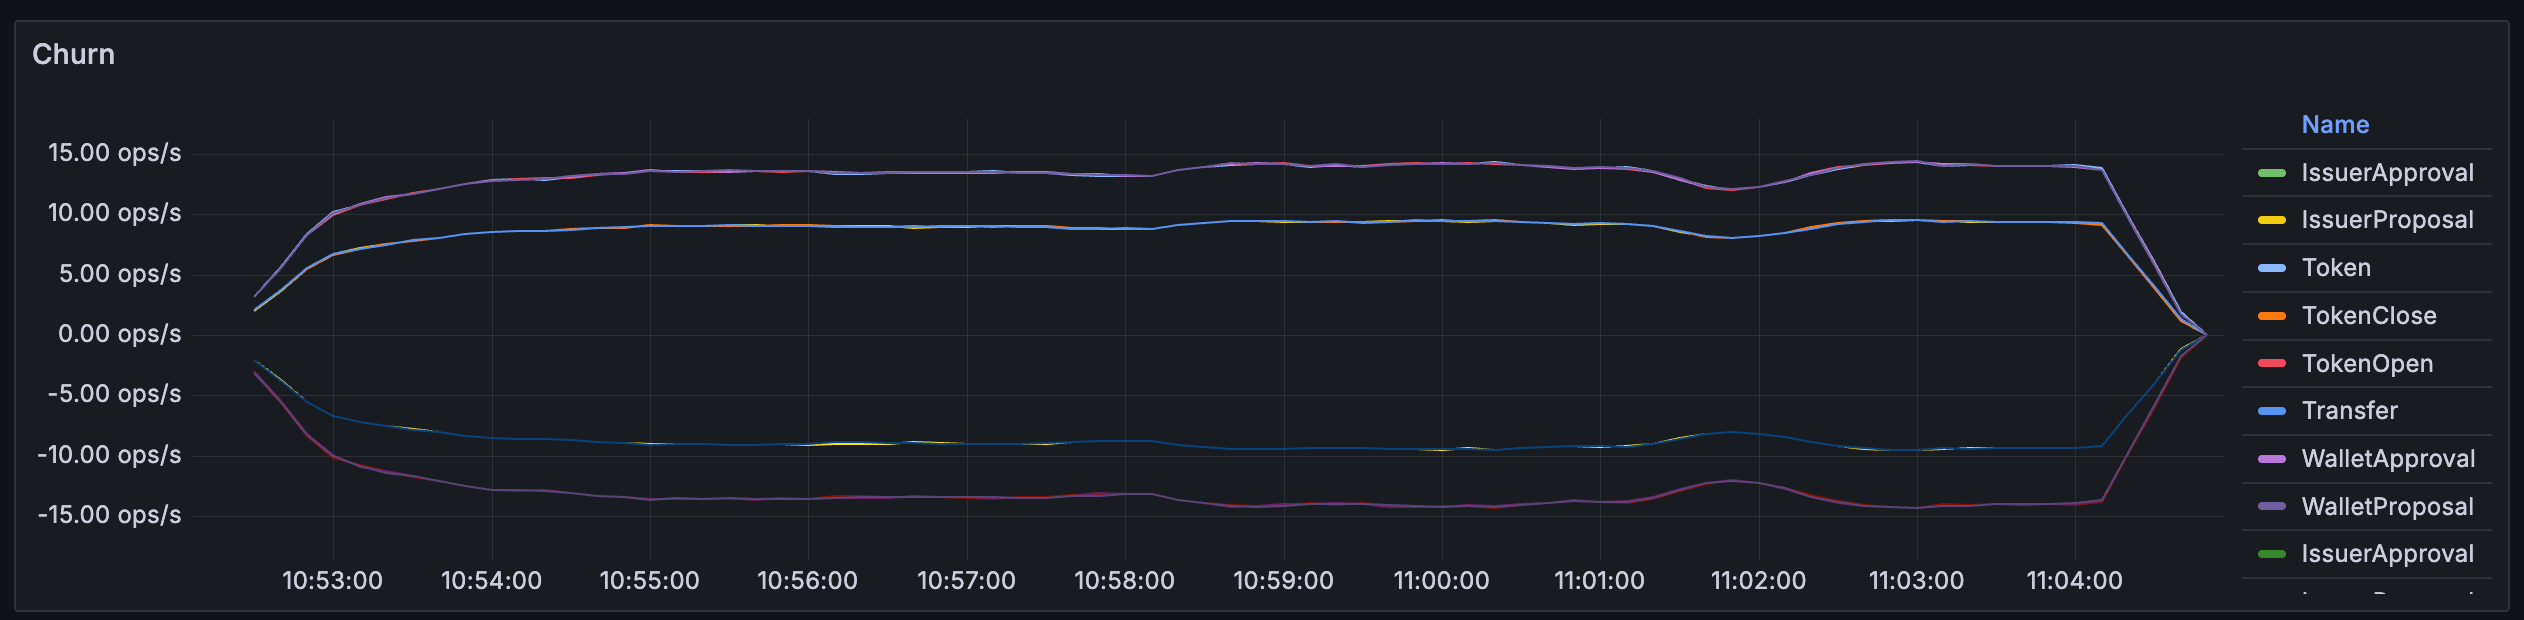
PQS Dashboard is designed to read from top to bottom. It provides information from general to more specific, so it is good practice to scan through the dashboard as it goes and spot anomalies along the flow.Contracts > Churn
Per-template activity (creates/archives) on the ledger. This chart may be useful to gauge relative throughputs in
business terms.
Contracts > Active
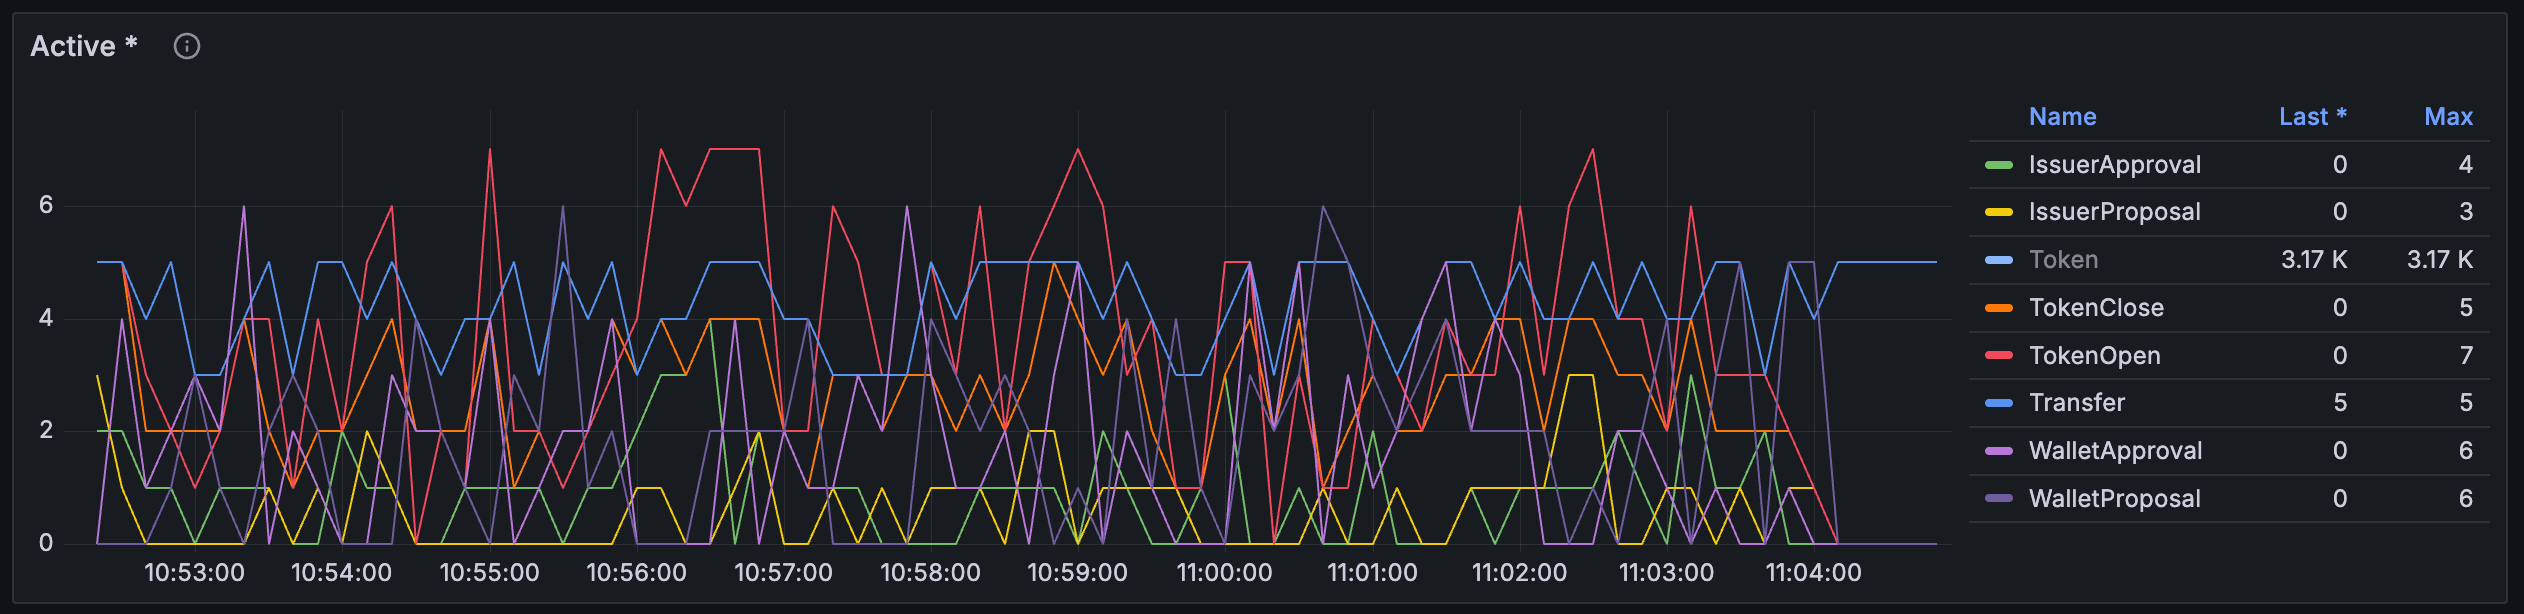
Per-template active contracts count. This chart may be useful to gauge composition of ACS
Throughput > Throughputs
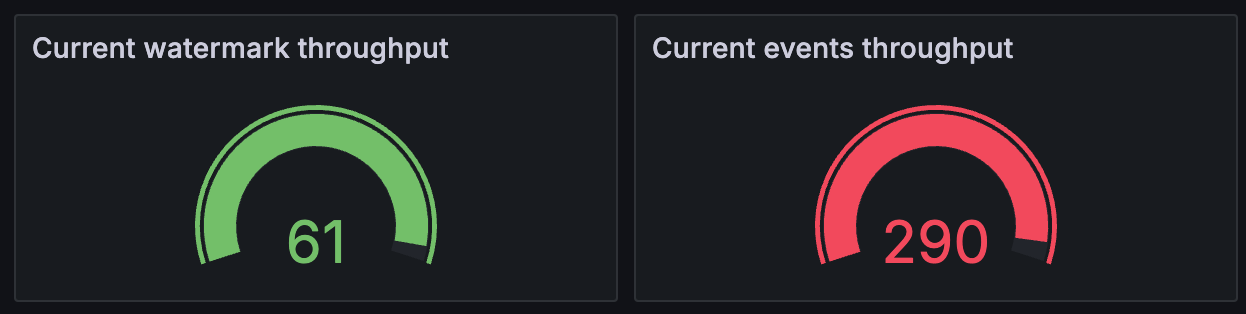
Current throughputs in terms of watermark advancement and stored events
Throughput > Ingested counts
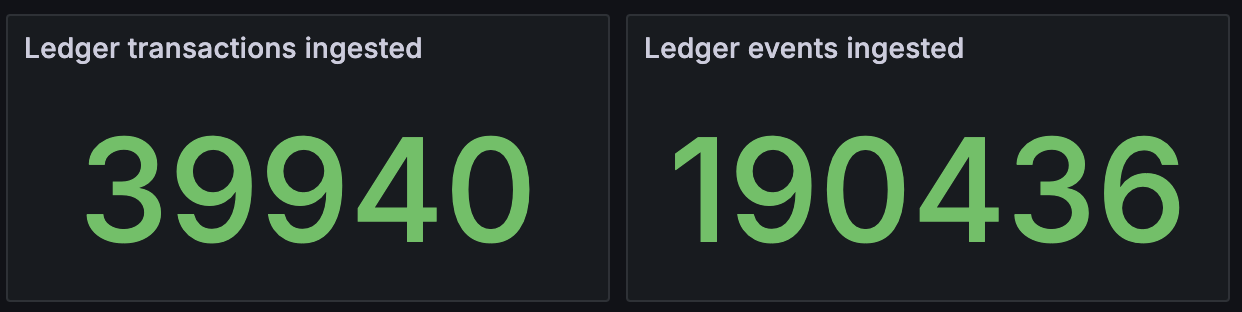
Total counts (as measured in transactions and events dimensions) since latest PQS start
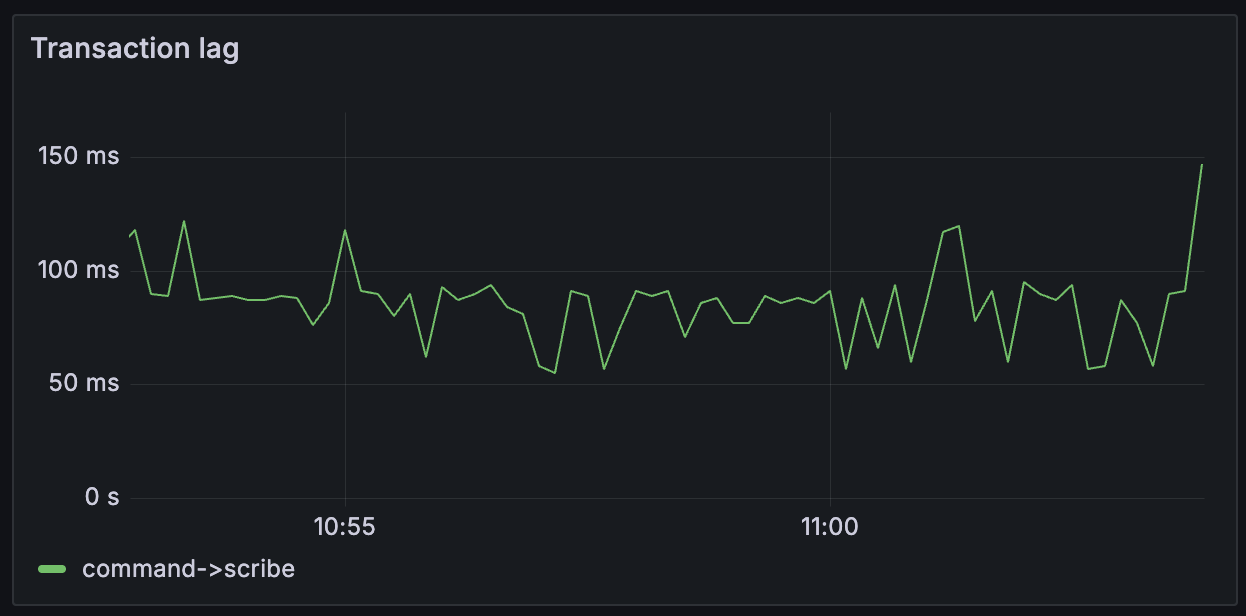
Throughput > Transaction lag
Tracks lag from ledger (delta between command completion determined by transaction’s effective_at attribute and
ingestion by PQS pipeline as determined by wall clock). This is latency introduced by upstream processes outside of
PQS control (Ledger API, network, etc). This chart indicates, for example, that 100 ms of latency has already been
contributed to the overall end-to-end processing latency:
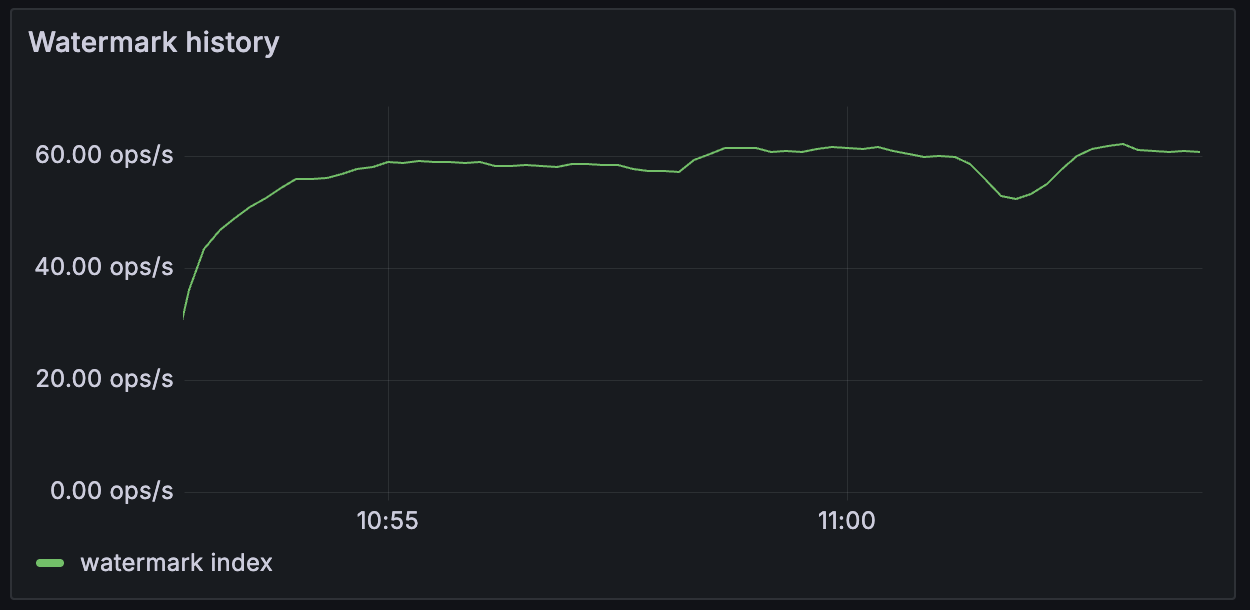
Throughput > Watermark history
Time series of watermark progression throughput. This manifests the rate of ledger transactions becoming available
for querying with PQS Read API functions. The typical shape of the chart is shown below. For uniform traffic it
should represent smooth curves.
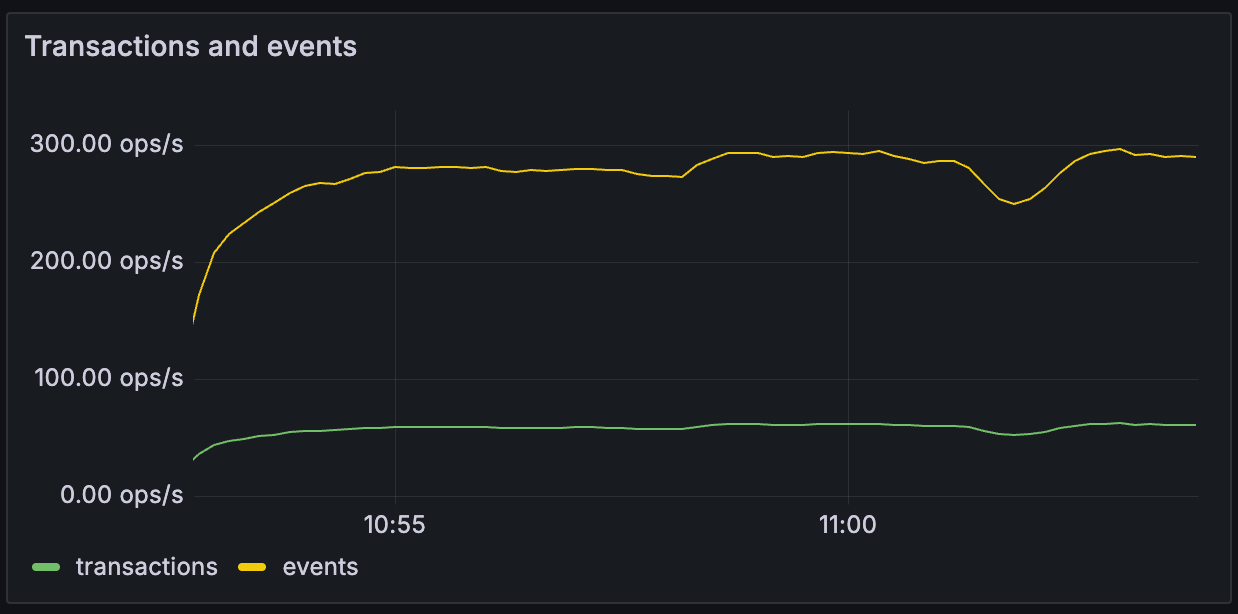
Throughput > Transactions and events
The shape of ingested traffic in terms of transactions and events dimensions. Provides an idea of the coarseness of
transaction sizes.
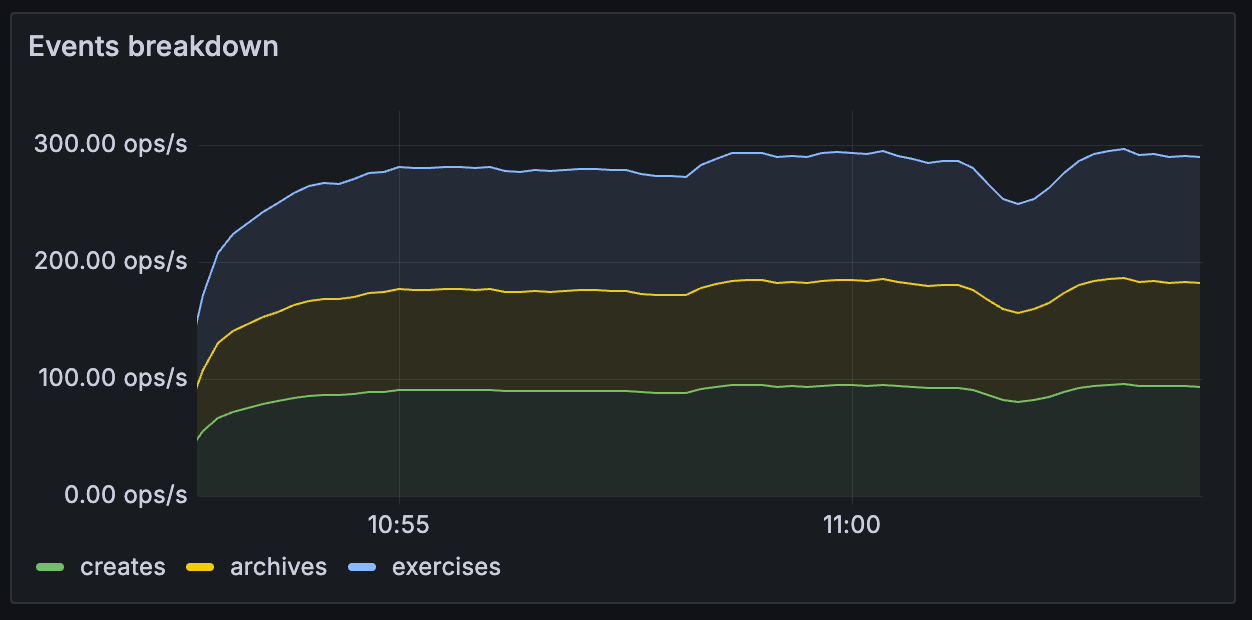
Throughput > Events breakdown
Provides breakdown of event types inside transactions (contents differs depending on pipeline source - flat
transaction vs transaction tree)
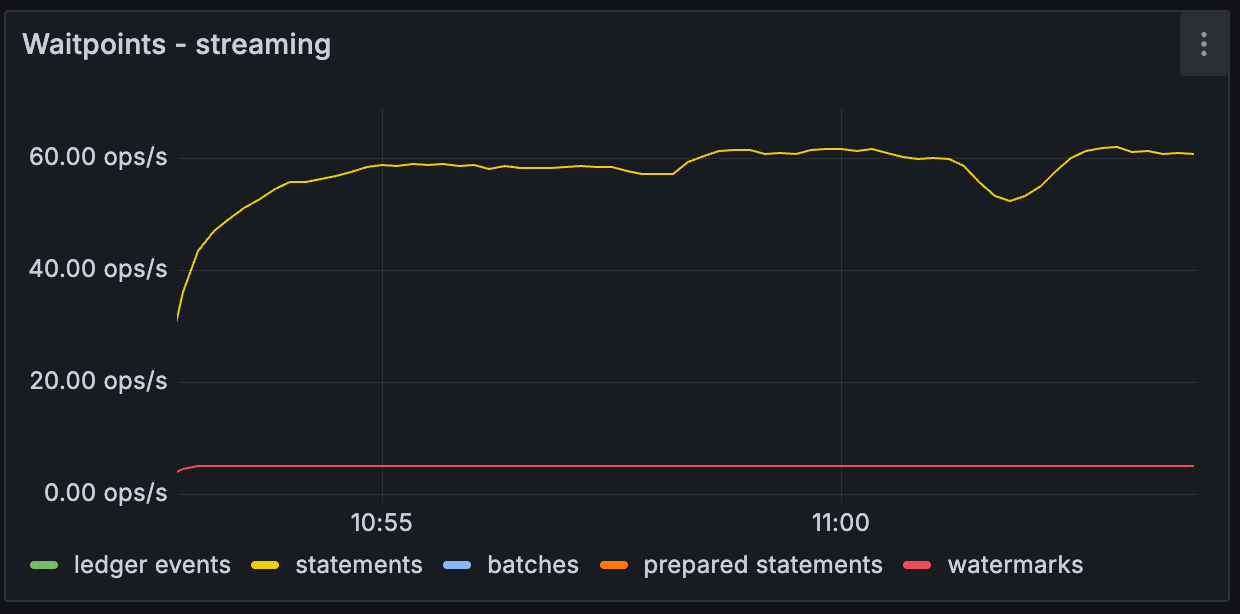
Throughput > Waitpoints - ACS / streaming
ACS = only during seeding from the ActiveContractSet Ledger API service
streaming = normal processing pipeline
The internal pipeline is composed of distinct stages separated by queues (aka wait points). This chart indicates
throughputs of items passing through them. Note that items might be distributed and consolidated at various stages,
therefore relative throughputs can differ between the stages even for streamlined flow.
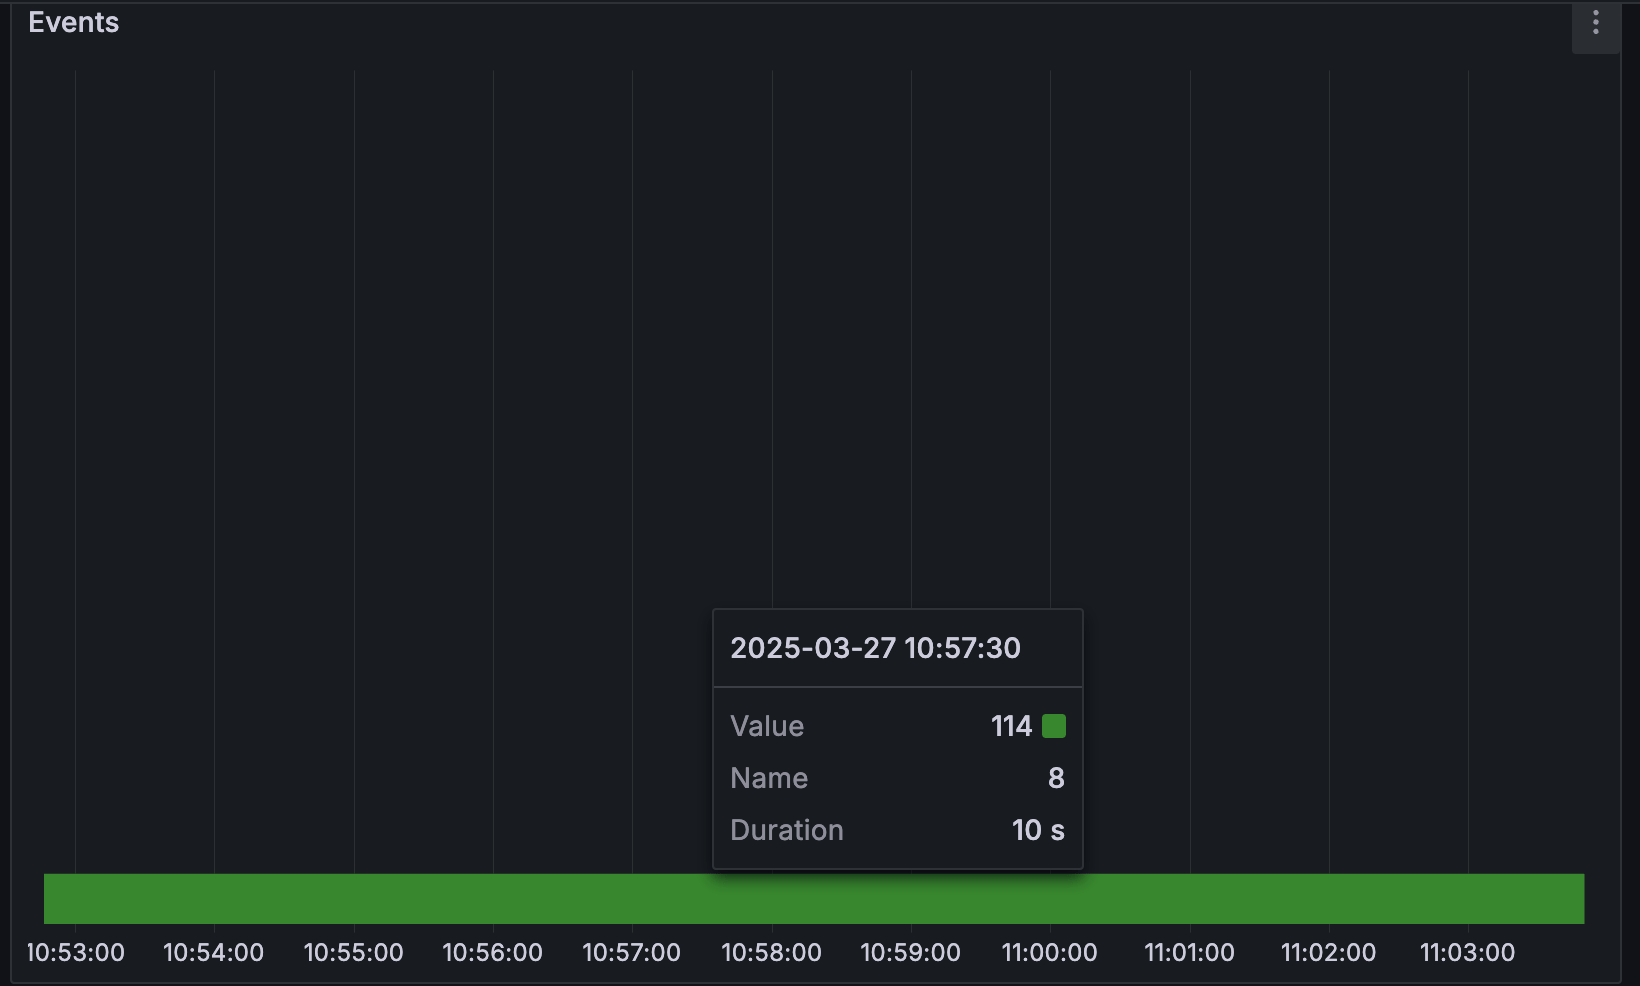
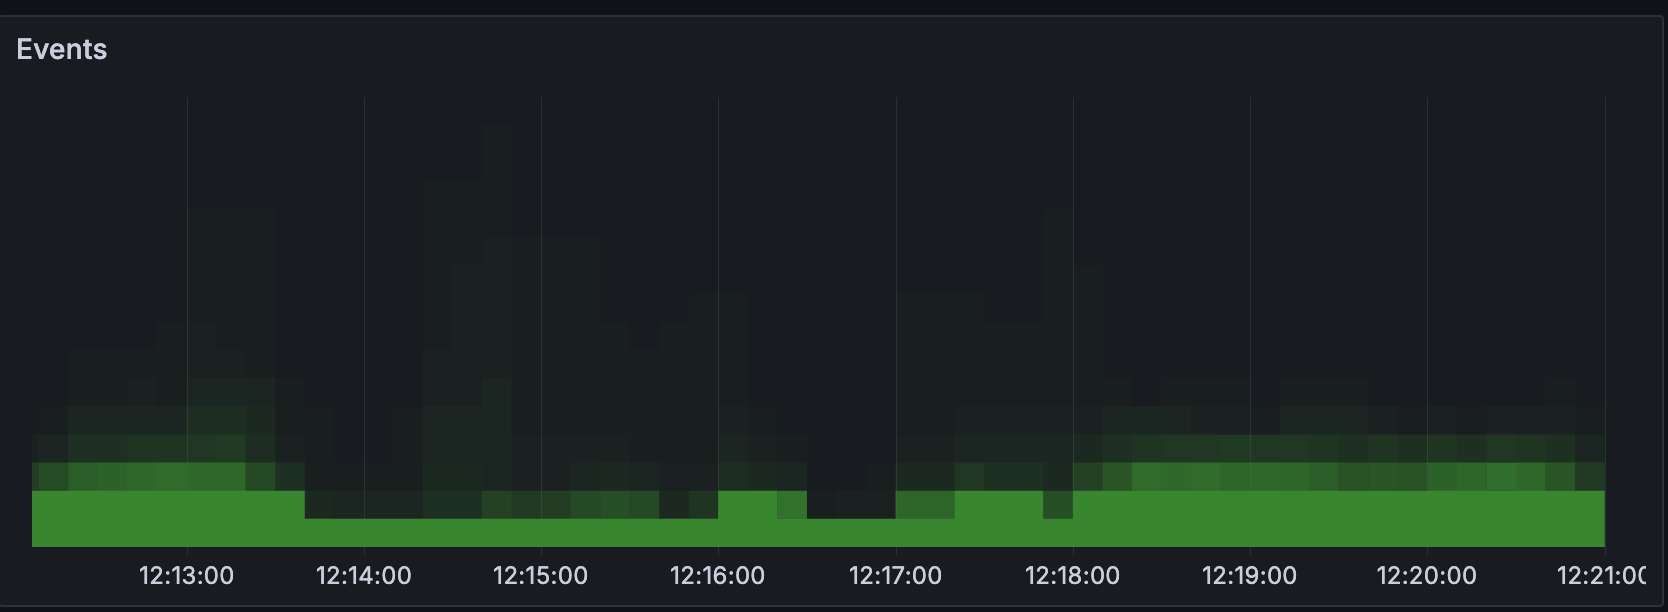
Queue sizes
Time-series of histograms (vertical slices) that represent queue size of named wait points. Bottom all-green line
indicates queue was empty all the time and this represents healthy situation without queueing or back-pressuring:
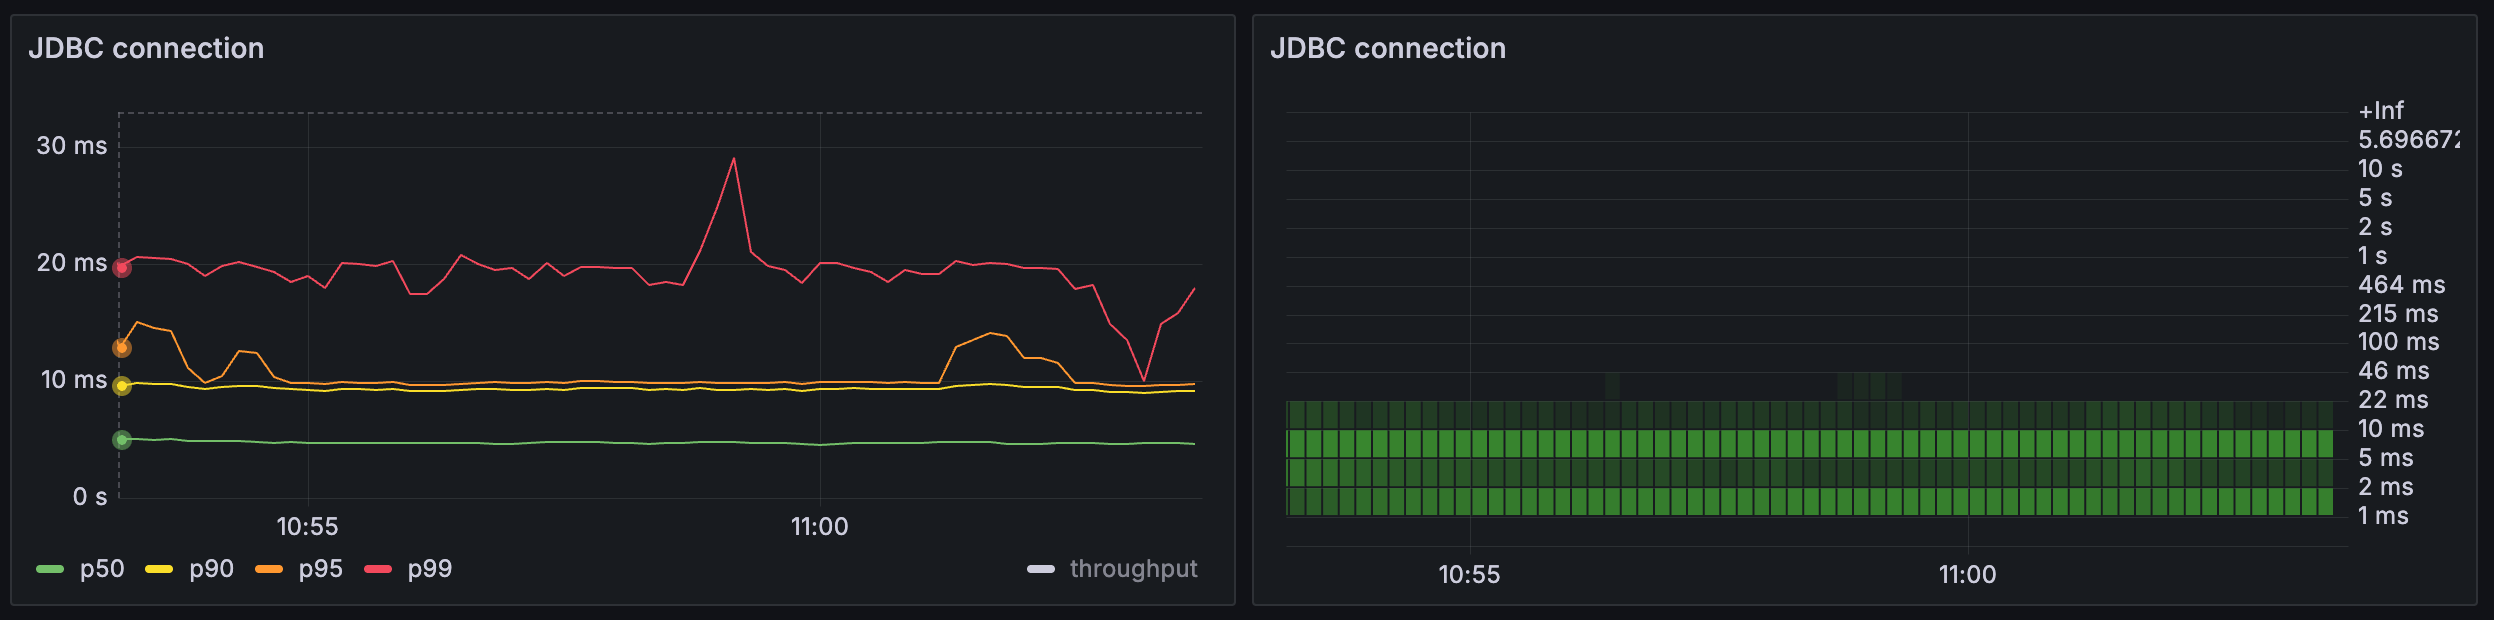
Latency
Time taken to transfer a unit of work between wait points with different levels of granularity. Provides a
percentile-based view as well historical histogram heatmap.
In this chart we can observe from the left panel that the majority of operations take less than 10 ms with some
outliers taking up to 30 ms. On the right chart we see more detailed insights, namely, there are two dominating
operations with average latencies 1 ms and 5 ms each.
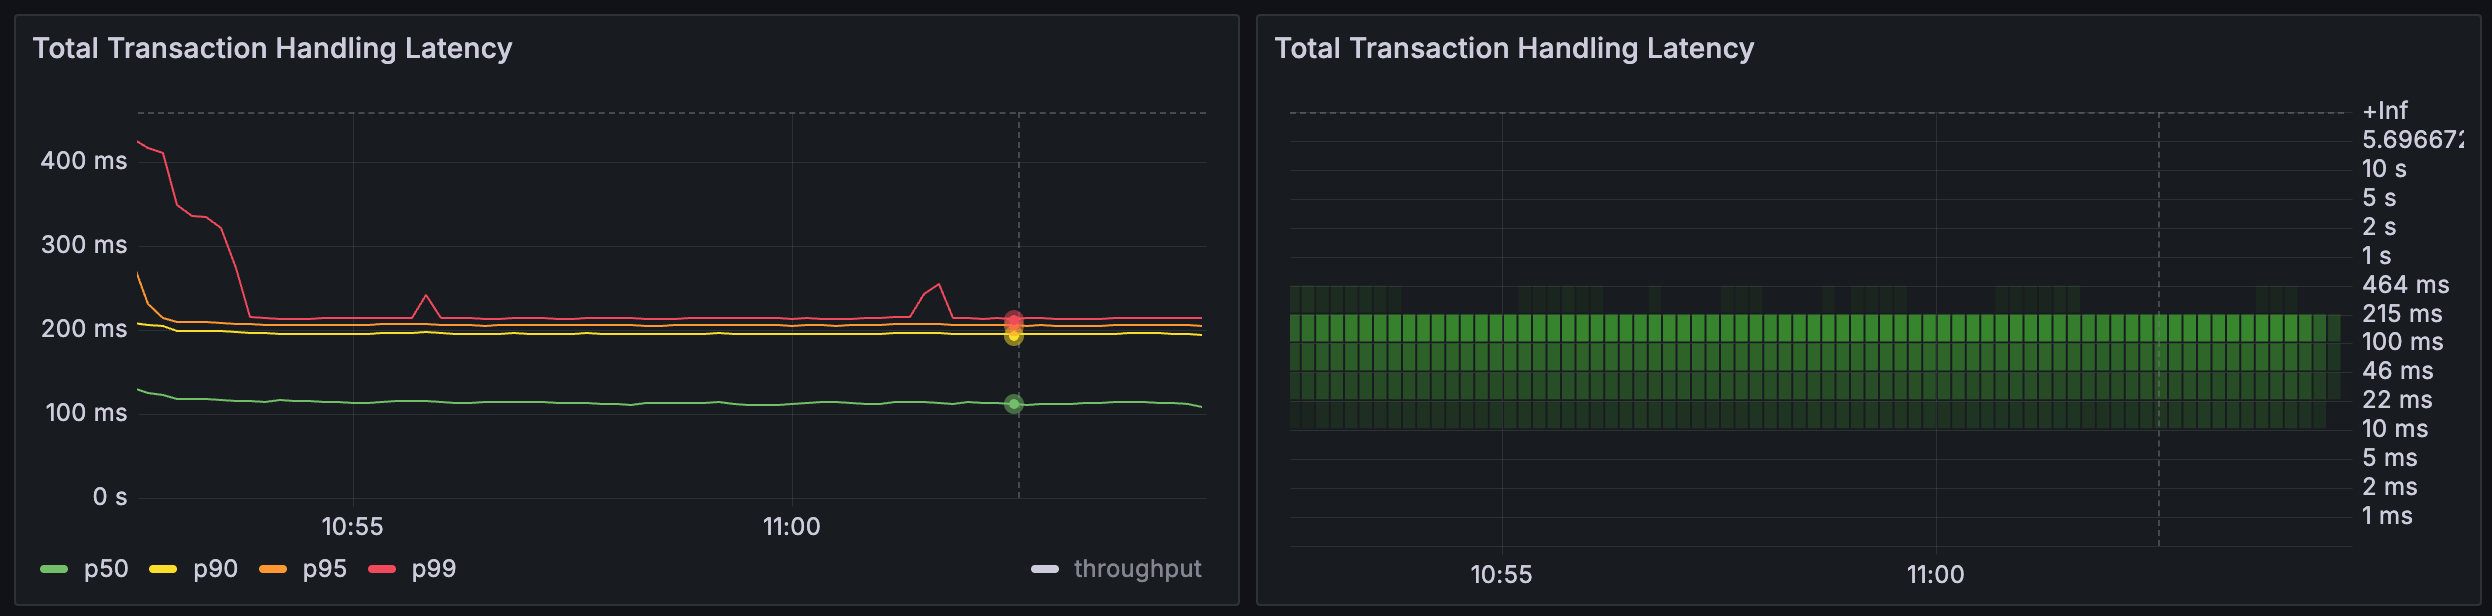
Latency > Total Transaction Handling Latency
Time taken by the entire PQS pipeline between receipt from Ledger API to being committed to Postgres.
JVM Metrics
Provides a series of metrics that are common across any JVM application in terms of memory management, CPU
utilisation and garbage collection activity. The most crucial signals to monitor and interpret are:
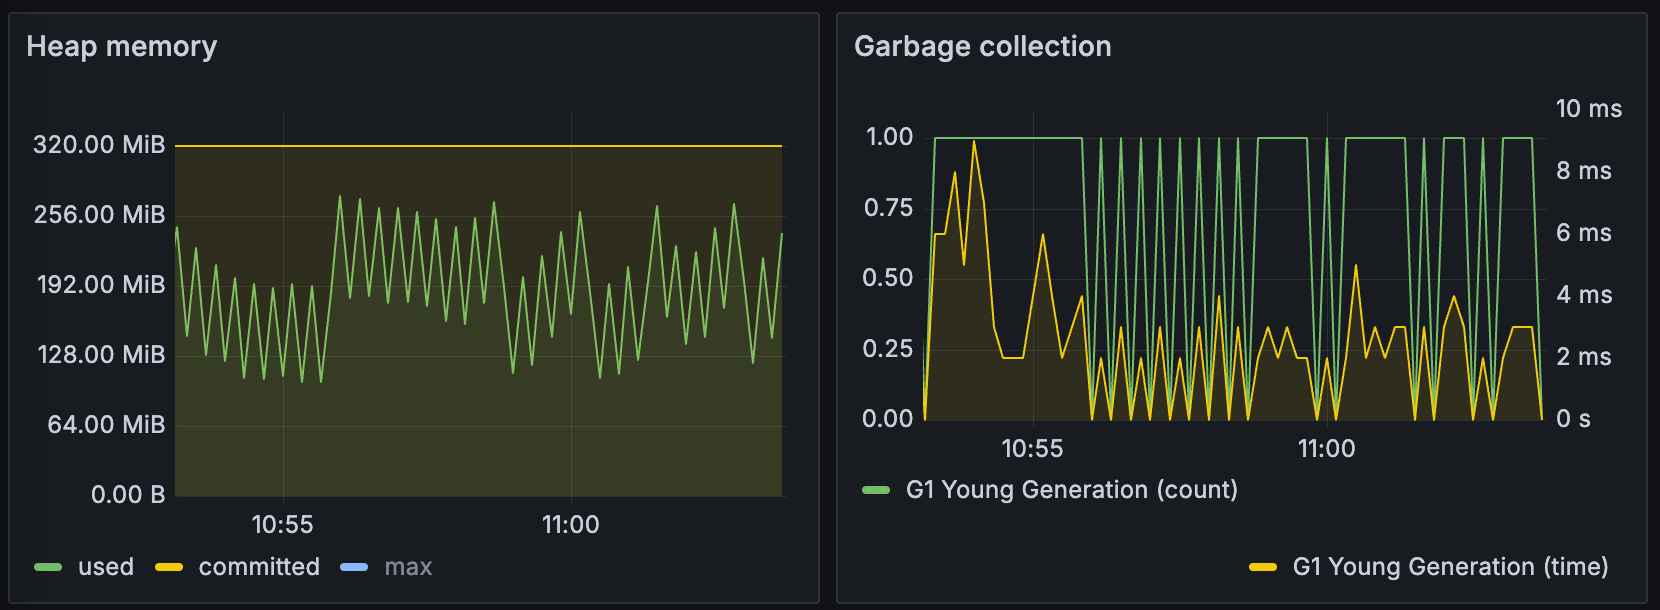
used approaching committed and never decreasing. At the same time garbage collection
frequency and time taken are increasing. These are the symptoms that out of memory conditions are imminent. If these
parameters look healthy but PQS still exists with 137 exit code, then most likely a supervisor (Docker,
Kubernetes) is terminating PQS forcefully - investigate potential configuration imbalance. Make sure that JVM
memory-related settings are applied.
SQL queries useful for troubleshooting
It is highly recommended that Postgres metrics are captured through appropriate tools (like postgres-exporter) and shipped into metrics storage (like Prometheus) for historical trends identification and analysis. The following visualisations useful for analysis would be possible for creation: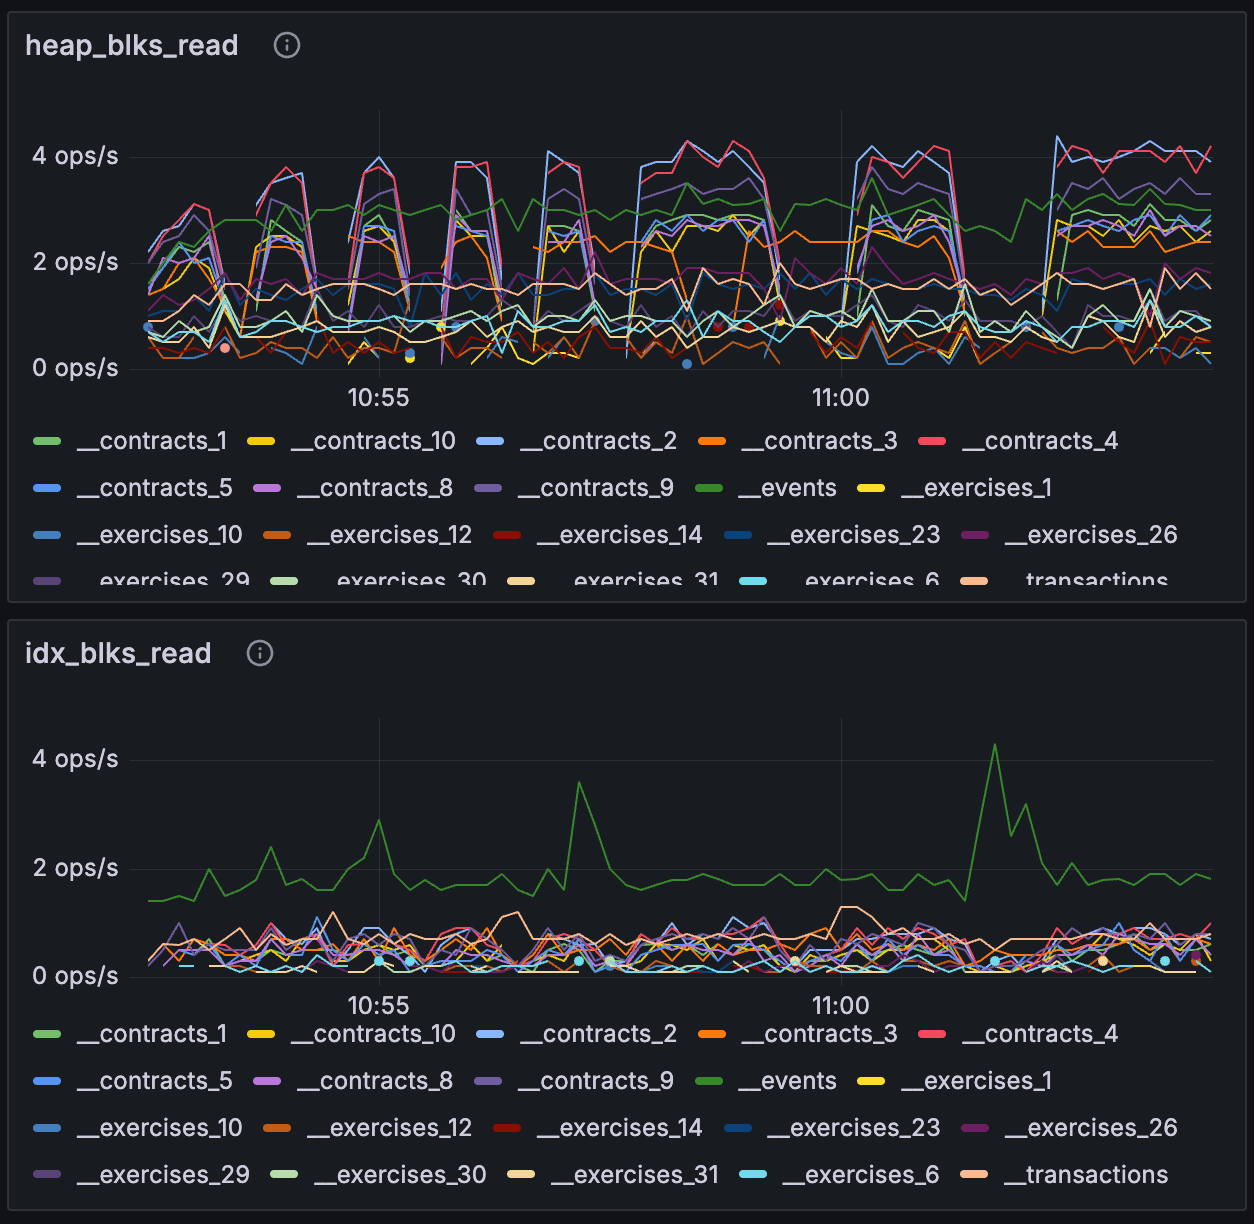
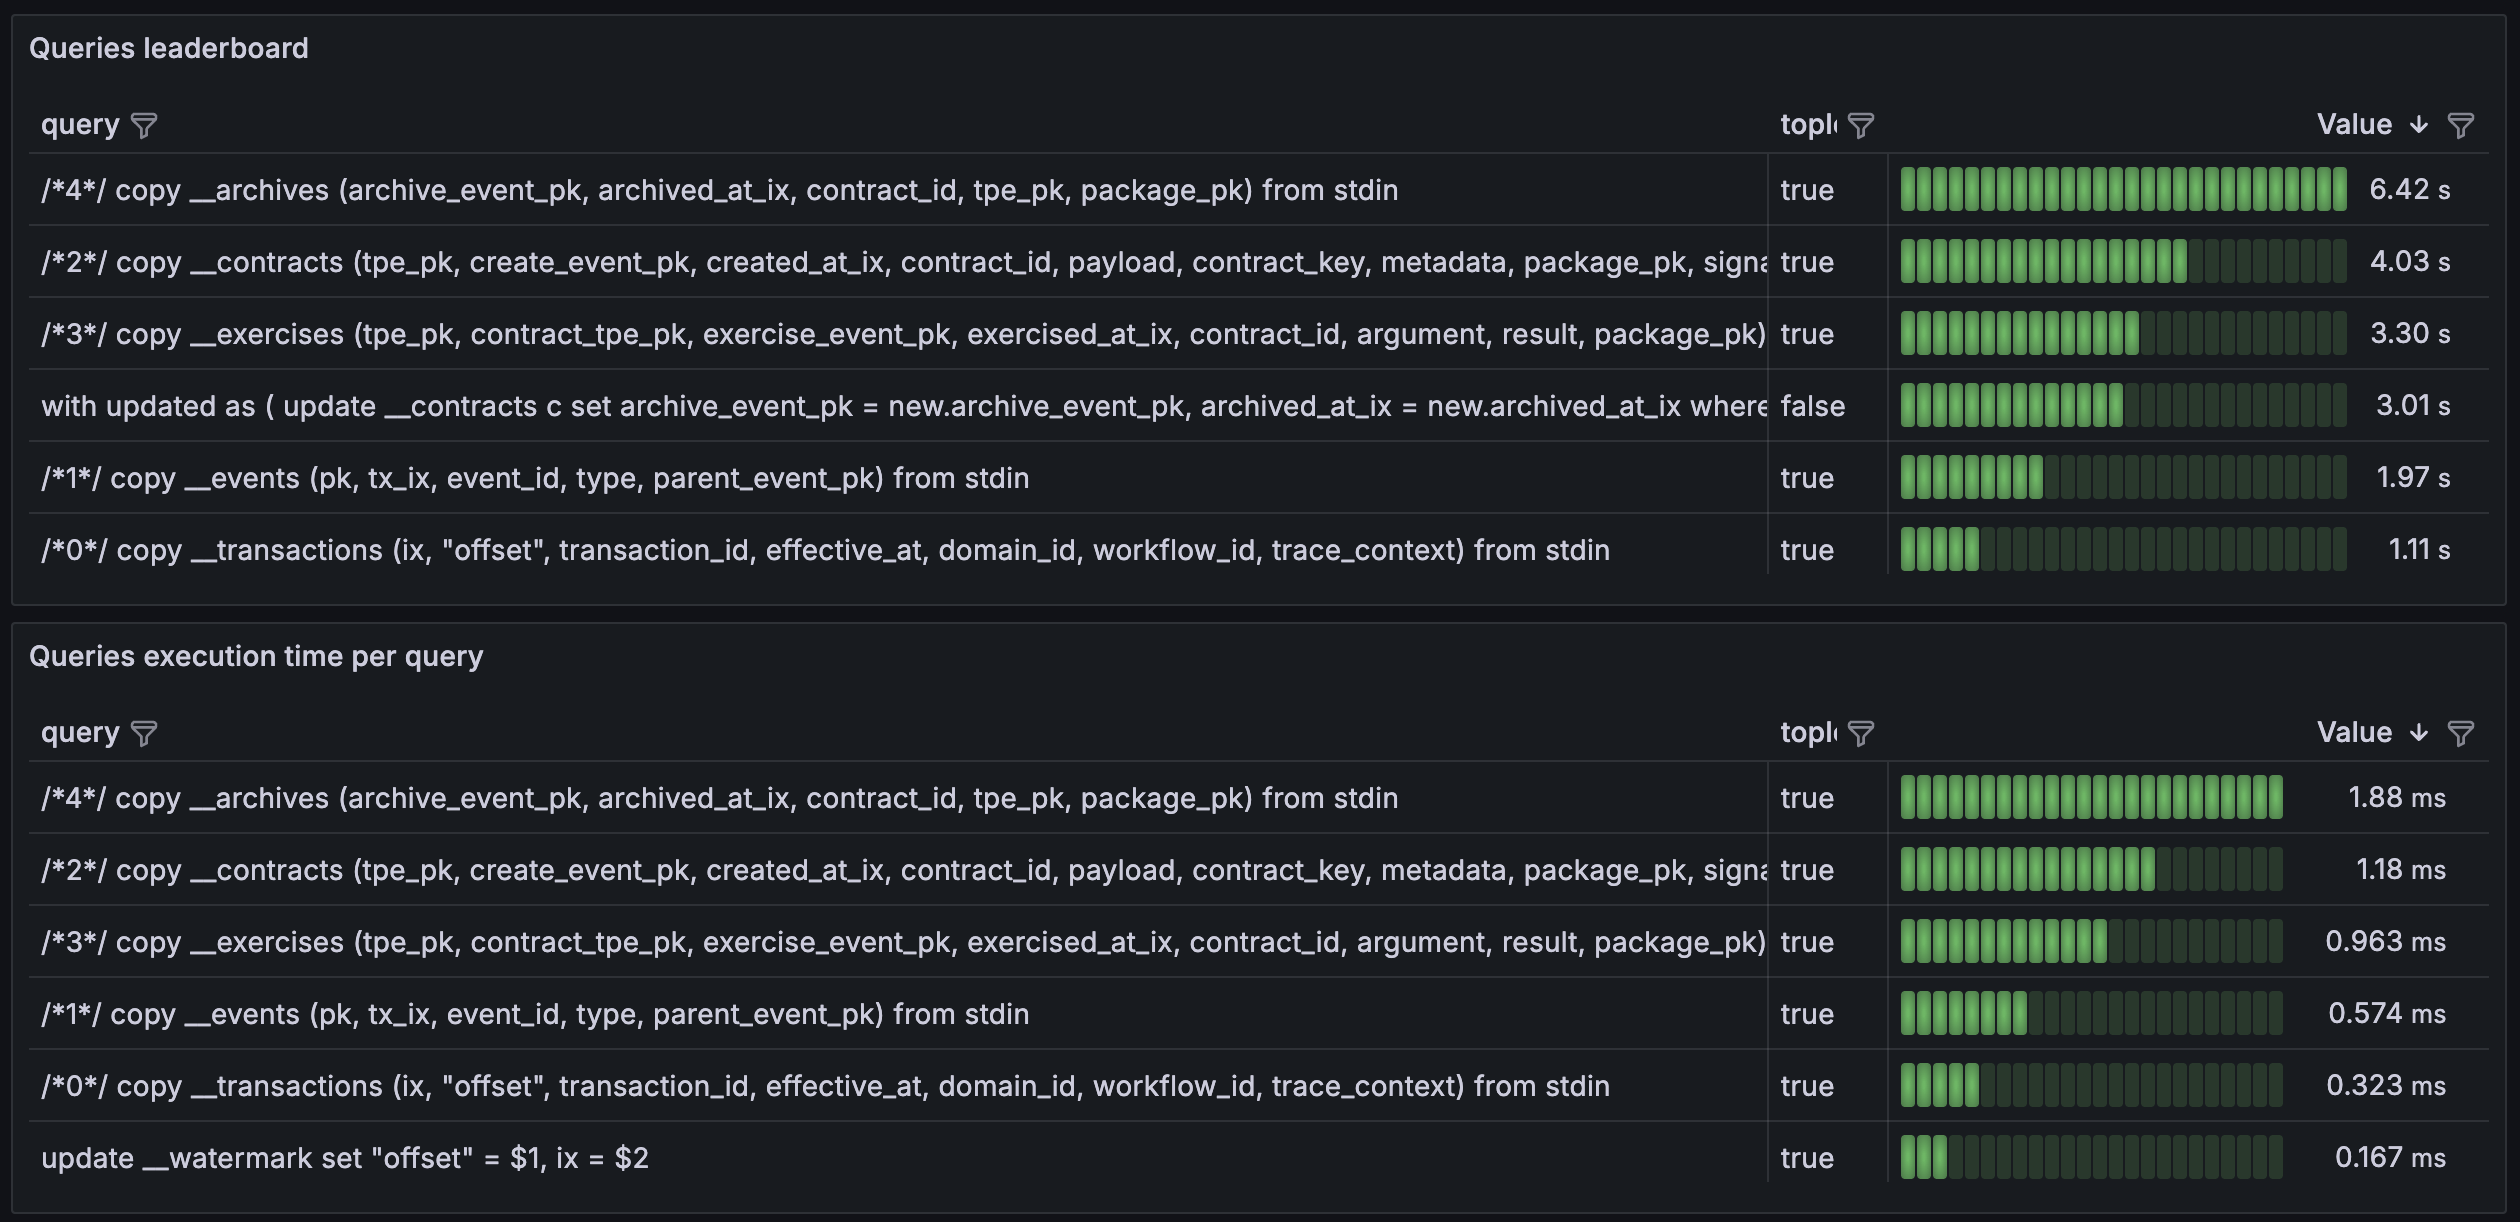
Statistics on disk vs index I/O
Currently executing queries
Top 10 queries by run time
This query requirespg_stat_statements
extension installed into PostgreSQL.